Blog
How to Transform Data into Natural Logarithm (Ln) in Excel

You may have seen research data transformed into other forms in analyzing research data. The data transformation is determined by changing the measurement scale of the original data into another form.
You are certainly familiar with the assumption test for those of you who have conducted linear regression analysis using the ordinary least square method. The assumption test consists of non-heteroscedasticity, normality, multicollinearity, linearity, and autocorrelation (for time-series data).
You certainly hope that, based on the data you get from the research results, you can fulfill all the required assumption tests. However, sometimes you have to face the fact that some assumption tests may not qualify.
Transforming data into other forms is one method that is quite popular when you encounter problems in the assumption test that I conveyed earlier. The main purpose of this data transformation is to change the measurement scale of the original data into another form so that the data can fulfill the required requirements.
Why does the assumption test need to be carried out as required? The assumption test was conducted to obtain the best linear unbiased estimator. Therefore, we need to understand how to transform data.
There are several types of data transformations, including root transformations, logarithms, arcsin, square, inverse, cubic, etc. On this occasion, you will discuss How to Transform Data into Natural Logarithm (Ln) in Excel.
One of the advantages of using the natural logarithm (Ln) is that Ln can minimize one of the deviations in the form of a non-constant variance (heteroscedasticity).
How to Transform Data into Natural Logarithm (Ln) in Excel
Data transformation can be conducted using various statistical software. In this article, I will determine the natural logarithm transformation using Excel.
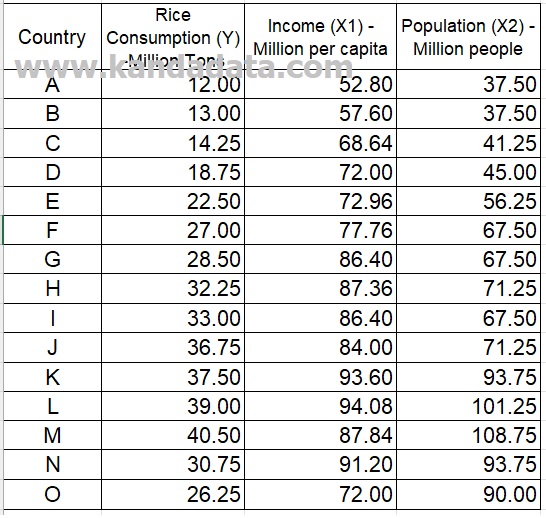
To make the exercise easier, I will use an example of a research case entitled: Effect of income and population on rice consumption. The variables used to consist of one dependent variable (rice consumption) and two independent variables (income and population). The data that will be used for exercise can be seen in the table below:
In the first step, you create 3 additional columns in Excel and write the labels with LnY, LnX1, and LnX2, respectively. Then you write the formula as follows:
=LN(…)
=LN(first data from variable Y)
=LN(12.00)
=2.48
In more detail, you can see in the image below:
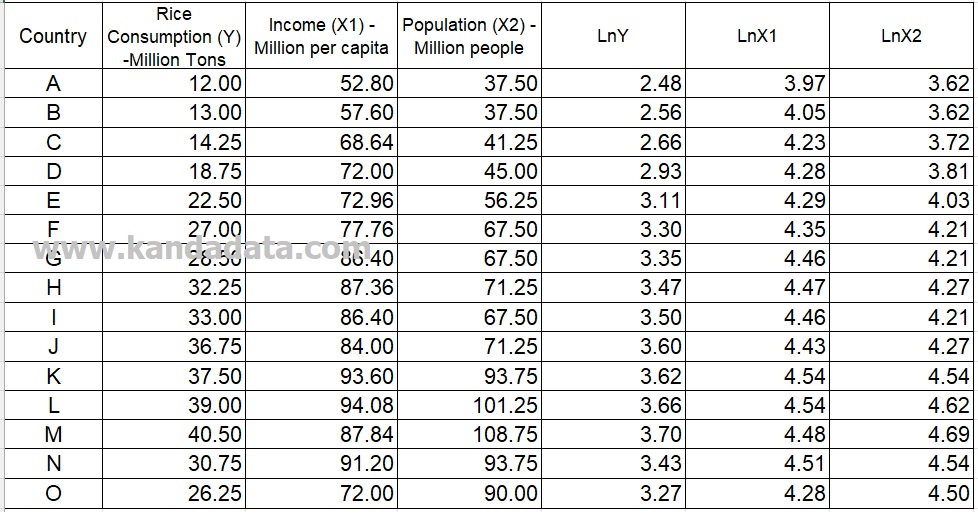
Based on the calculations using the excel formula, the Ln result of 12.00 is 2.48. Next, you copy-paste the formula up to the last data of the Y variable. In the same way, you transform it for the X1 and X2 variables.
The results of the data transformation into the natural logarithm form that I have finished can see in the table below:
For a deeper understanding of data transformations, I recommend the book Introduction to Statistics: An Intuitive Guide for Analyzing Data and Unlocking Discoveries. This user-friendly guide is perfect for building a strong foundation in statistical analysis.
Well, that’s all I can convey about How to Transform Data into Natural Logarithm (Ln) in Excel. I hope it will be beneficial for you. See you in the next article!


Pingback: How to Reverse Natural Logarithm to Initial Data in Excel - KANDA DATA
Pingback: How to use data transformation to address issues with non-normally distributed data - KANDA DATA