
Data transformation is an effort to change the measurement scale of raw data into another form so that the data can meet the assumptions required for the chosen statistical test. One form of data transformation is the use of natural logarithm transformation.
Typically, researchers perform data transformation to remove data outliers, make data more symmetric, or change the data scale. Data transformation is crucial in analyzing research data, so researchers should carefully consider and understand it well.
The choice of transformation depends on the characteristics of the measured variable. Additionally, the scale of data measurement is also a consideration when performing data transformation.
Natural Logarithm Data Transformation
Natural logarithm transformation is one of the data transformation techniques frequently employed by researchers. This transformation involves using the natural logarithm (e = 2.71828) to convert original data into a form suitable for statistical analysis.
The natural logarithm function (ln) is the exponent to which the value e must be raised. The advantage of this transformation is that it tends to mitigate the impact of outliers in the data.
The natural logarithm transformation also commonly addresses heteroscedasticity issues in ordinary least squares (OLS) linear regression analysis. Furthermore, it can make the data more symmetric, achieving a normal distribution.
Points to Consider in Natural Logarithm Transformation
The use of the natural logarithm transformation should align with the characteristics of the collected data. Not all data types can be transformed using the natural logarithm.
In cases where research data contains zero or negative values, this transformation cannot be applied. Therefore, if a significant portion of the data has zero or is negative, researchers are advised to choose a different data transformation method.
How to Transform Data Using Excel
We can efficiently perform a natural logarithm transformation on data using Excel’s “LN” function. The first step is to prepare the data we want to transform using the natural logarithm on one of the Excel sheets.
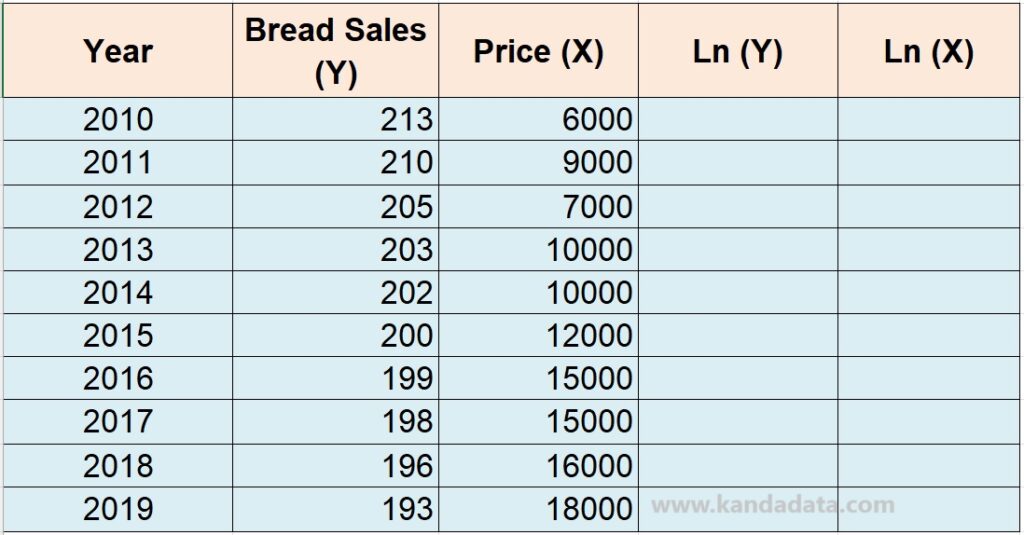
Here, I have an example dataset that we will transform using the natural logarithm. The data consists of two variables: sales and price. Both variables are measured on a ratio scale.
The second step is to create a new column next to the original data according to the desired transformation results. I’ve added two columns labelled LN(Y) and LN(X). In detail, the data used for the transformation can be seen in the table below:
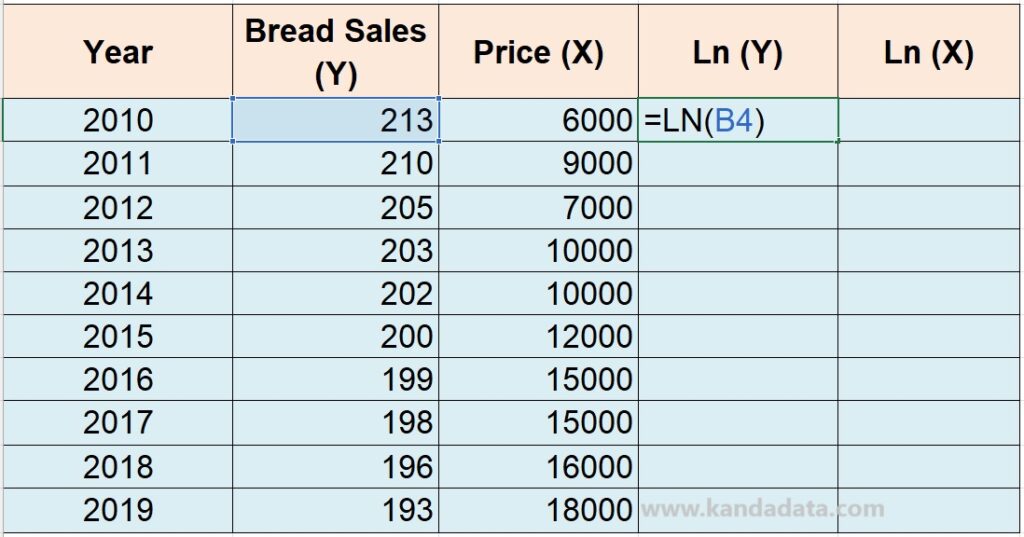
The third step is to select the first cell in the new column, type or click inside that cell, and then use the LN function following this format: LN(…). Here, for the first cell in cell B4, the Excel formula would be written as LN(B4), as shown in the table below:
After entering the formula into the cell, press the “Enter” key. The result of the natural logarithm transformation will appear in the newly created cell. The fourth step is to copy this formula to other cells in the new column to transform the entire dataset.
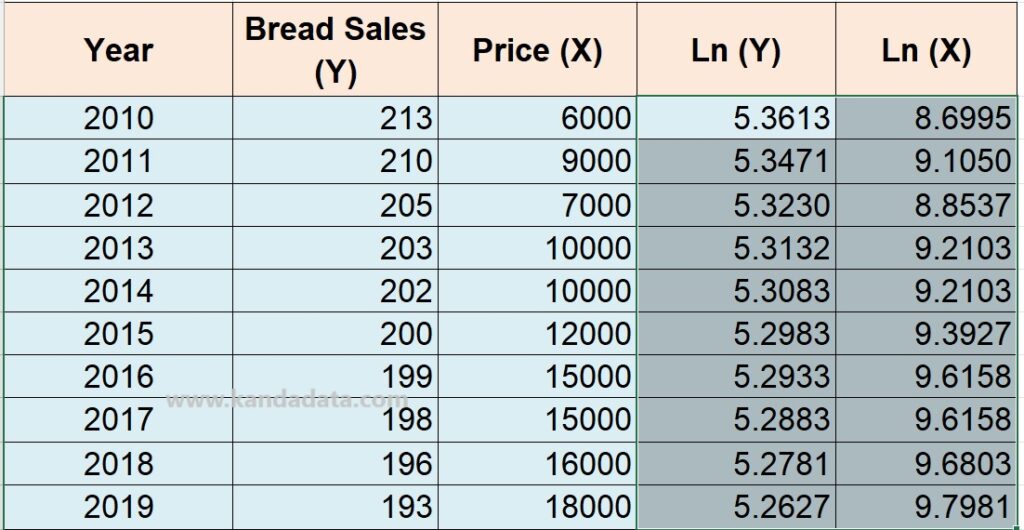
You can do this by dragging the small square handle at the bottom right corner of the newly created cell downward. Alternatively, you can copy and paste the formula into other empty cells. In detail, the results of the data transformation into natural logarithm form can be seen in the table below:
Should You Analyze Data Using Original Data or Transformed Data?
The decision to use original data or data transformed into natural logarithm form in data analysis depends on the analysis objectives and the characteristics of the data at hand.
If we have decided to transform the data into natural logarithm form, then the subsequent analysis will use the data we have transformed using Excel. Researchers sometimes choose transformed data to help address the assumptions required and make the data more suitable for further analysis.
Transformed data will yield different results compared to the original data, and the interpretation will also differ. It’s essential to ensure that we understand and can communicate in publications or papers that the analysis is based on transformed data.
Sensitivity analysis can also be conducted to compare the results of analyses using the original data and data transformed into natural logarithm form.
That concludes the article I can provide for now. I hope it proves beneficial to those in need. Stay tuned for the following educational article update in the coming week. Thank you.
