Blog
Calculate Coefficients bo, b1, b2, and b3 Manually (3 Independent Variable) in Multiple Linear Regression

Multiple linear regression is a regression analysis consisting of at least two independent variables and one dependent variable. In several articles I have written previously, I have discussed calculating multiple linear regression with two independent variables manually.
Because of the importance of researchers understanding how to calculate the estimated coefficient of multiple linear regression, on this occasion, “Kanda Data” will write an article about a tutorial on manually calculating multiple linear regression with three independent variables using Excel.
Calculation of the estimated regression coefficients in simple linear regression the calculation method is easier than in multiple linear regression. In the previous article, calculating using two independent variables is more complex than simple linear regression.
In multiple linear regression with three independent variables, the formula is different to obtain the estimated regression coefficient value. Various methods can be used to calculate the estimated regression coefficient value in multiple linear regression using three independent variables. On this occasion, I will give a tutorial on calculating the estimated regression coefficient using a matrix approach.
Mini research example for exercise
This mini-research is intended to determine the effect of 3 independent variables on one dependent variable. In detail, this study aims to determine the effect of advertising costs, marketing staff and sales bonuses on product sales. As exercise material, I have prepared 15 monthly time series data.
The specifications of the regression equation from this mini-research are:
Y = b0 + b1X1 + b2X2 + b3X3 + e
where,
Y = Product sales (Unit/Month)
X1 = Advertising cost (USD/month)
X2 = Marketing staff (Person)
X3 = Sales bonus (USD/unit sold)
b0 = Intercept
b1, b2, b3 = regression estimation coefficient
e = Error term
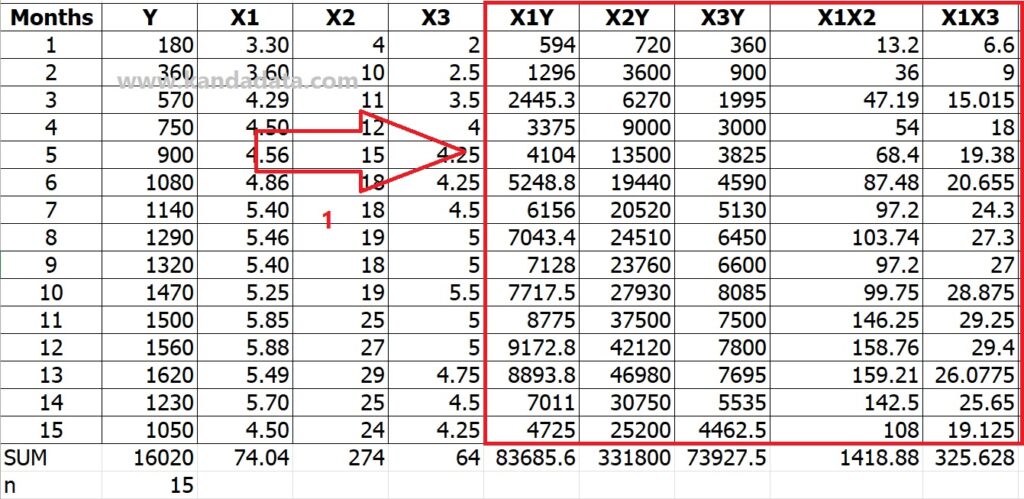
Researchers have collected monthly time series data from the 1st month to the 15th month with the details of the data collection results as follows:
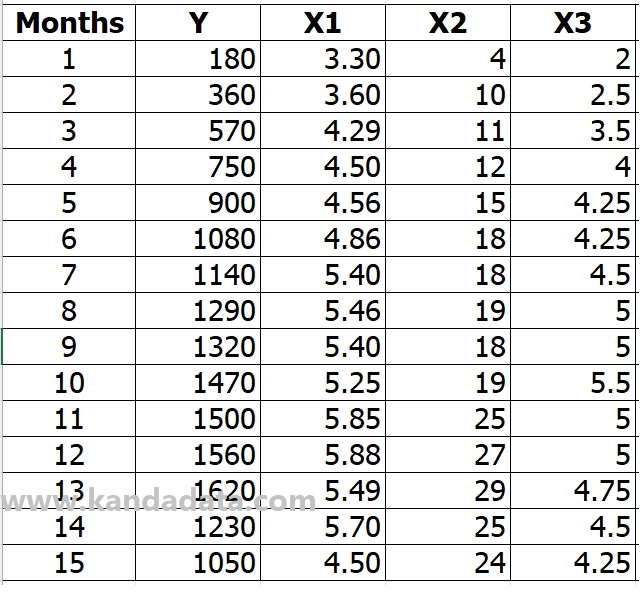
The formula for calculating the regression estimation coefficient with the matrix approach
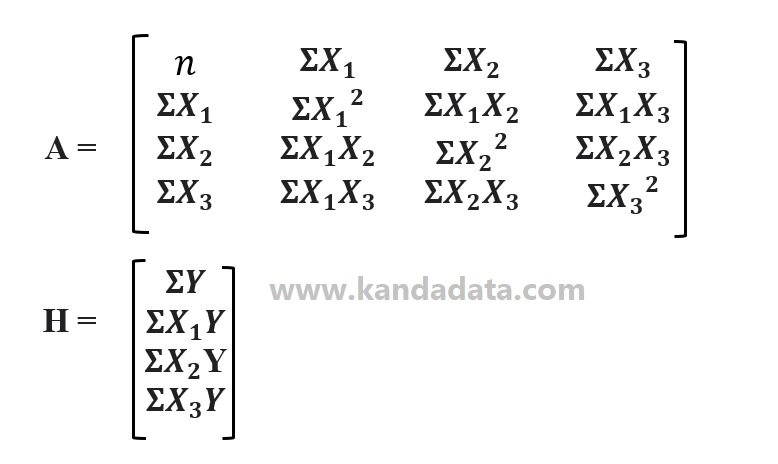
Based on what I wrote in the previous paragraph, I will use a matrix approach to calculate the estimated coefficient values of b0, b1, b2, and b3. On this occasion, I use two matrices, matrix A and matrix H. Matrix A uses a matrix of ordo 4 * 4 and matrix H uses order 4 * 1. In more detail, the matrix elements used on this occasion can be seen as follows:
Create Formula Templates in Excel
After we know and understand the matrix formula used to calculate the estimated regression coefficient, I will use Excel to make the calculations easier. I use Excel to make calculations easier and avoid errors during the manual calculation process.
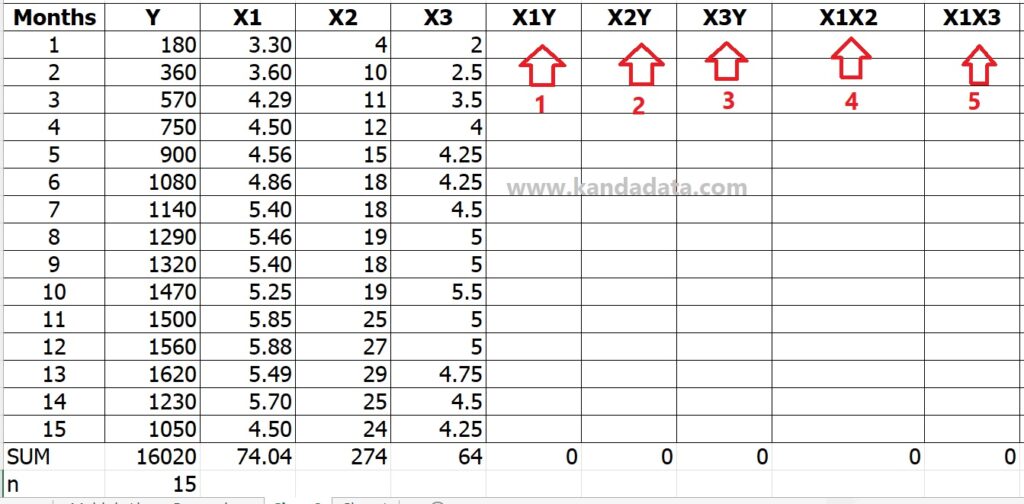
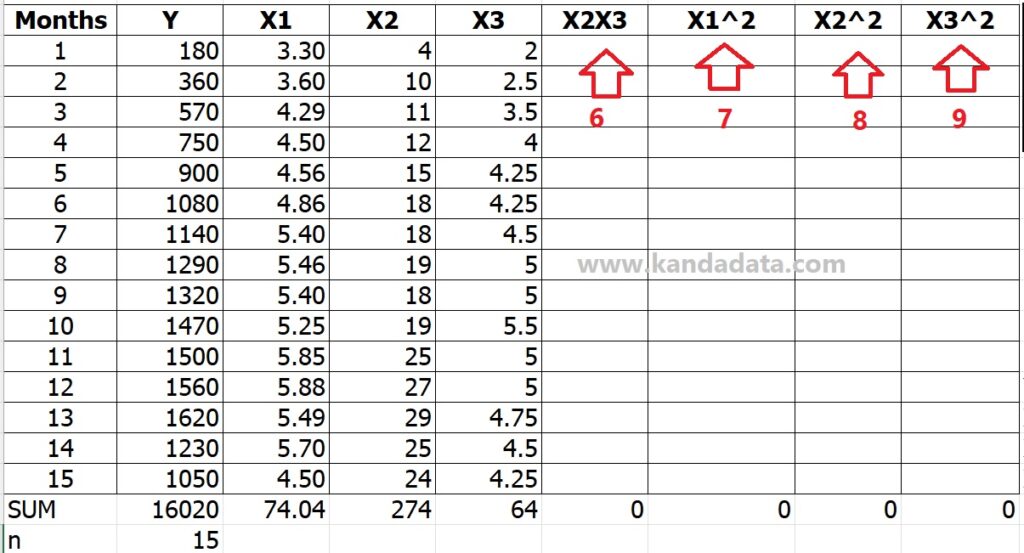
Next, I will create additional columns in Excel according to the components of the matrix elements in both the A matrix and the H matrix. In the Excel template that I use to calculate the estimated regression coefficients, I added nine additional columns according to the needs of the elements in matrix A and matrix H.
To avoid calculation errors, I created additional columns in Excel sequentially according to the formula in the matrix. In the Excel template, I put arrows and numbered 1 to 9. In more detail, the Excel template that I use to calculate regression estimates with a matrix approach can be seen in the image below:
Conducting Manual Calculations Using Formula Templates in Excel
The next step after we create a calculation template using Excel is to do the calculations manually. Because we are using Excel, we can use the formulas in Excel to calculate each element of the matrix in the Excel column.
We need to perform mathematical operations according to the formula of each element of the matrix. We do this manual calculation starting from the 1st column to the 9th column.
Next, we need to add up each column starting from the actual data to the matrix element calculation column. The results of the calculation of the matrix template in detail can be seen in the table below:

The formula for calculating the regression estimation coefficient
After calculating each matrix element using the formula template in Excel, the next step is calculating the intercept and the estimated regression coefficients. To calculate the regression coefficient, we need to calculate the determinant of the formula matrix. To calculate the determinants of the matrix can be seen in the image below:
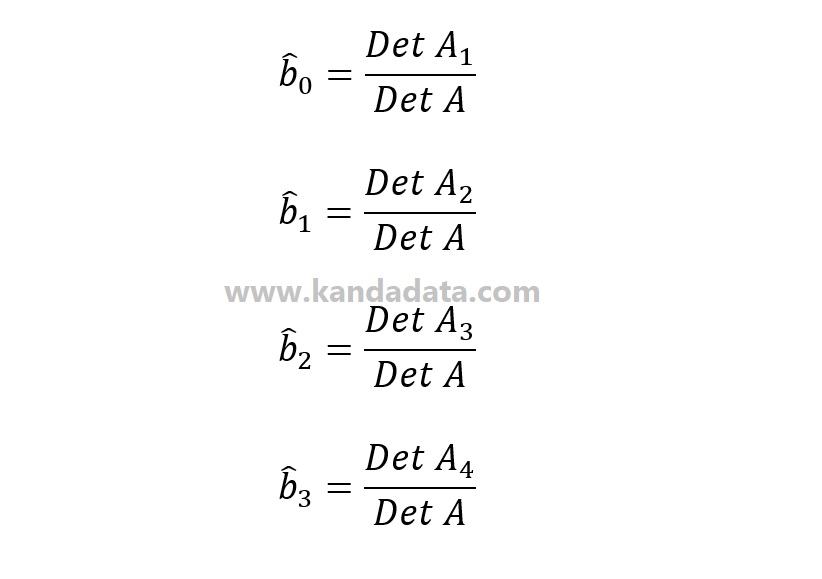
Based on the above formula, you need to calculate the value of the determinant starting from the determinant A, H, A1, A2, A3, and A4. To calculate the determinant, we can use formulas in Excel.
However, we need to create auxiliary tables according to matrix A and H elements. Next, using an Excel template, you fill in each matrix element according to the calculation results. The results of the calculations on the A, H, A1, A2, A3, and A4 matrices can be seen in detail as follows:

After you arrange the matrix elements as in the picture above, then you determine the value of the determinant of each matrix that has been compiled in Excel. To find the determinant, you can use the formula = MDETERM(…). Next, you block all the matrix elements in each matrix.
Next, you will get the value of the determinant of the matrix. The next step, there is a need to calculate the coefficients of bo, b1, b2, and b3 using the formula I have written above. The final results of the detailed regression coefficient calculations can be seen in the image below (marked in yellow):

Recheck Manual Calculation Results with Statistical Software Output
To ensure the results of the manual calculations we have done are correct, we can compare them with the statistical software output. We can use several tools, including SPSS, SAS, STATA, and others. On this occasion, I will use the data analysis toolpak in Excel.
The consideration is that I’ve been using Excel for manual calculations from the beginning. If it turns out that you haven’t found the data analysis menu in Excel, it means you need to activate the data analysis toolpak. You need to do a few simple steps to enable the data analysis toolpak in Excel.
Based on the results of the analysis using the data that we use for manual calculations of multiple linear regression with three independent variables, it can be seen in the image below:
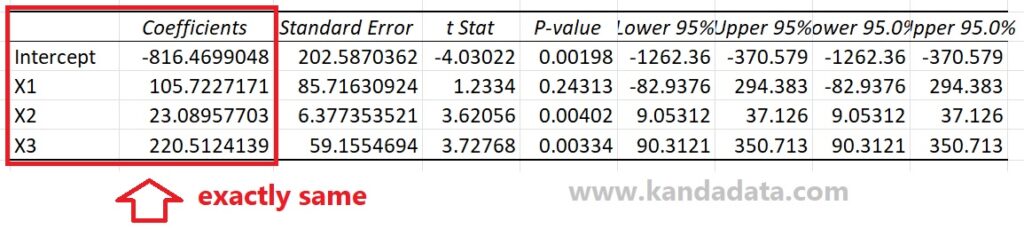
Based on the picture above, I only took part of the results of the analysis using Excel, which displays the coefficients of bo, b1, b2, and b3. Based on the comparison between the results of manual calculations and the output of the data analysis toolpak in Excel, we already knew that the results were exactly the same. Learn the basics of multiple regression analysis in Multiple Regression: A Primer (Research Methods and Statistics).
Thus we can conclude that the results of the manual calculations we have done are correct. That’s the tutorial article I can write for you. Hopefully, it will be useful for all of you. Thank you!