Blog
How to Analyze Multiple Linear Regression and Interpretation in R (Part 1)
Multiple linear regression analysis has been widely used by researchers to analyze the influence of independent variables on dependent variables. There are many tools that researchers can use to analyze multiple linear regression.
One of the tools that can be used is R. To facilitate the use of R; researchers can install R Studio. Because it is based on open source, researchers can independently install R on their own laptop or PC.
Multiple linear regression analysis in R can be easily and accurately performed by researchers. In addition to multiple linear regression analysis, researchers also need to perform assumption tests, including normality, heteroscedasticity, multicollinearity, and linearity.
Given the need for researchers to have an understanding of data analysis in R, in this opportunity, Kanda Data wrote a tutorial on how to analyze multiple linear regression and interpret the results in R. This is the first part of a total of 5 articles that write tutorials on multiple linear regression analysis and assumption tests in R.
A Mini Study Using Multiple Linear Regression Analysis
As a practice material for multiple linear regression analysis, an example of a mini-study has been prepared, which aims to determine the effect of cost and marketing on the sales of a product.
The specifications of the linear regression equation consist of one dependent variable and two independent variables. The data was collected by the researcher at 15 sales outlets owned by a company in region X. The data that has been collected by the researcher can be seen in the table below:
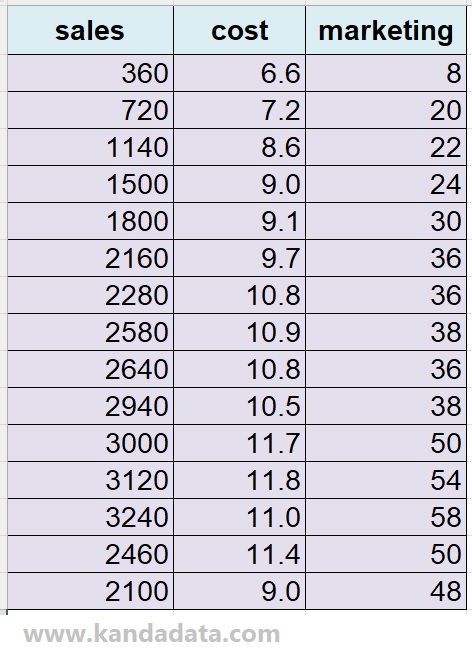
Based on the table above, the researcher sets a research hypothesis that cost and marketing simultaneously have a significant effect on sales.
In addition, the researcher also formulates a statistical hypothesis for partial effects where, assuming marketing is ceteris paribus, cost partially has a significant effect on sales. Furthermore, assuming cost is ceteris paribus, marketing partially has a significant effect on sales.
How to Import a Dataset from Excel to R
Inputting data for analysis in R can be done manually or by importing data. Since I have input the research data into Excel, in this tutorial, I will provide information on how to import a dataset from Excel to R.
Importing a dataset in R can be done easily by researchers independently. Here, I assume that R has been integrated into R Studio.
The steps that researchers need to do are to click “file,” then from the various options available, click “import dataset.” Researchers will be given a choice of data sources used, whether from Excel, SPSS, or others.
Because I previously saved the data using Excel, select “from Excel.” In the next step, researchers will be faced with a window where they are asked to browse the location where the Excel file is saved.
Next, a preview of the data inputted into Excel will appear. Researchers can check whether the data is complete or not. If the data has been confirmed to be complete, click “Import” at the bottom.
If these steps have been done correctly, a preview of the imported data from Excel will appear in R Studio. The data is now ready to be analyzed using multiple linear regression.
The Syntax for Multiple Linear Regression Analysis in R
After successfully importing data from Excel to R, the R Studio main menu will display the syntax for importing the data. The next step is to perform multiple linear regression analysis in R. Researchers can use the following syntax to perform multiple linear regression analysis:

Based on the above syntax, the first step that researchers can take is to type the syntax for multiple linear regression analysis. The syntax Sales ~ Cost + Marketing is adjusted according to the number of variables used. The left side indicates the dependent variable, and after the ~ sign, it is filled with the names of independent variables separated by the + sign. Please pay attention to the capital and lowercase letters of variable labels; type them exactly as they appear in the R Studio preview.
Next, the syntax data = Multiple_Linear_Regression indicates the source of data used. Please type it exactly the same as the file name used when importing the data. To make it easier, researchers can refer to the syntax View(Multiple_Linear_Regression).
After pressing enter, the next step is to view the summary of the model. Researchers only need to type the syntax summary(model) in R, as shown in the above picture. After pressing enter, the output of the multiple linear regression analysis will appear.
Interpreting Multiple Linear Regression Analysis Output in R
The output of multiple linear regression analysis in R is similar to other analytical tools. The detailed results of multiple linear regression analysis in R can be seen in the figure below:
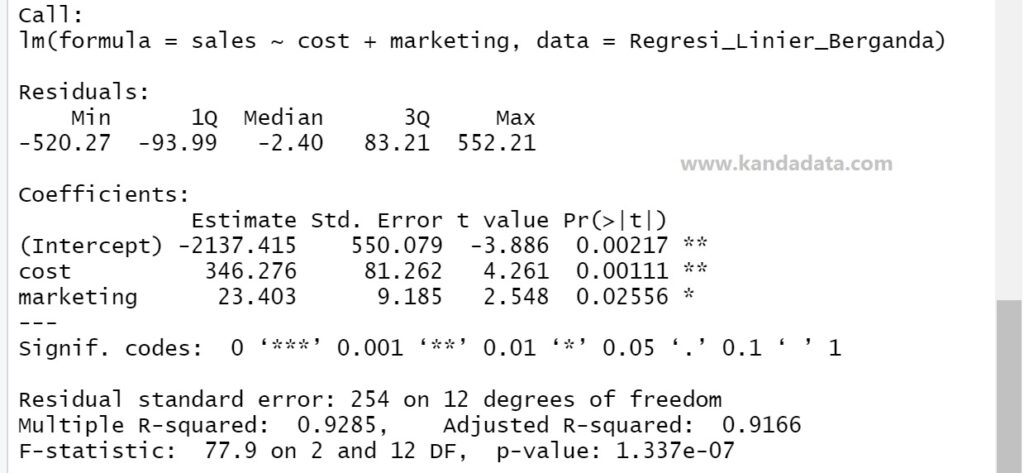
Based on the figure above, the first step in interpreting the results is to look at the goodness of fit of the model. To determine if the model is good, researchers can use the coefficient of determination or R-squared value.
In the figure above, the multiple R-squared values is 0.9285. This can be interpreted as the variance of the independent variables, which is 92.85%, which can explain the variance of the dependent variable. The remaining 7.5% of the variance in the dependent variable is explained by other variables that are not included in the multiple linear regression equation. This indicates that the model can be considered good because the R-squared value is close to 1.
To test the research hypothesis, researchers can look at the significance level of the F-statistic and t-statistic. The first hypothesis is that both cost and marketing significantly affect sales simultaneously. To test this hypothesis simultaneously, researchers can look at the F-statistic value.
Based on the F-statistic value of 77.9, it is known that the p-value is less than 0.05. Therefore, the null hypothesis is rejected, and it can be concluded that both cost and marketing have a significant simultaneous effect on sales.
Furthermore, to test the hypothesis partially, researchers can look at the t-statistic value of each variable. For the cost variable, the t-statistic value is 4.261, and the p-value is less than 0.05. This indicates that the null hypothesis is rejected, and it can be concluded that cost partially has a significant effect on sales.
As for the marketing variable, it has a t-statistic value of 2.548 with a p-value less than 0.05. This indicates that marketing partially also has a significant effect on sales.
If you need to perform multiple linear regression analysis using Excel, please read the previous tutorial article entitled “How to Perform Multiple Linear Regression using Data Analysis in Excel.”
Well, this is a tutorial on how to perform and interpret multiple linear regression analysis in R. Hopefully, this article provides benefits and new insights for all of you. Please wait for the next article update next week. Thank you.
Pingback: How to Test Heteroscedasticity in Linear Regression and Interpretation in R (Part 3) - KANDA DATA