Blog
How to Calculate Net Present Value (NPV) to Assess Investment Viability

Net Present Value (NPV) is a crucial investment evaluation method employed to assist companies in determining whether an investment or project will yield financial gains or losses over a specified period. NPV is the difference between the present value of cash inflow and the present value of cash outflow from an investment over a specific timeframe.
In business, NPV aids corporate leaders in making more precise and rational investment decisions. Whether to accept or reject a project can be influenced by NPV, among other considerations.
One advantage of using the NPV metric is its ability to calculate the time value of money. Additionally, it incorporates a discount rate reflecting investment risk. The final analysis results are easily interpretable.
Discount Rate
In NPV analysis, the discount rate adjusts the future cash flow value to its present value. The discount rate reflects the cost of capital or the expected rate of return. A higher discount rate corresponds to a lower present value of future cash flows.
NPV sensitivity to the discount rate can yield lower or even negative results at higher discount rates. A less sensitive NPV indicates that the project may be more stable and reliable under various economic conditions. When making investment decisions, companies can compare NPV with a discount rate appropriate to the project’s risk.
Investment Decision Criteria Based on NPV
In general, investment decision criteria based on NPV are as follows:
NPV > 0: The project or investment is acceptable as it adds value to the company (positive NPV).
NPV < 0: The project or investment is not financially feasible (negative NPV).
NPV = 0: The project or investment is balanced, and the decision may depend on other managerial considerations (zero NPV).
Case Study Example: NPV Calculation
To provide a deeper understanding, I’ve compiled Net Cash Flow data from a company measured in USD. The company invested $45,000 in 2013 and obtained a net cash flow of $80,000 in 2023. Detailed Net Cash Flow data can be seen in the table below:

Calculating NPV Manually using Excel
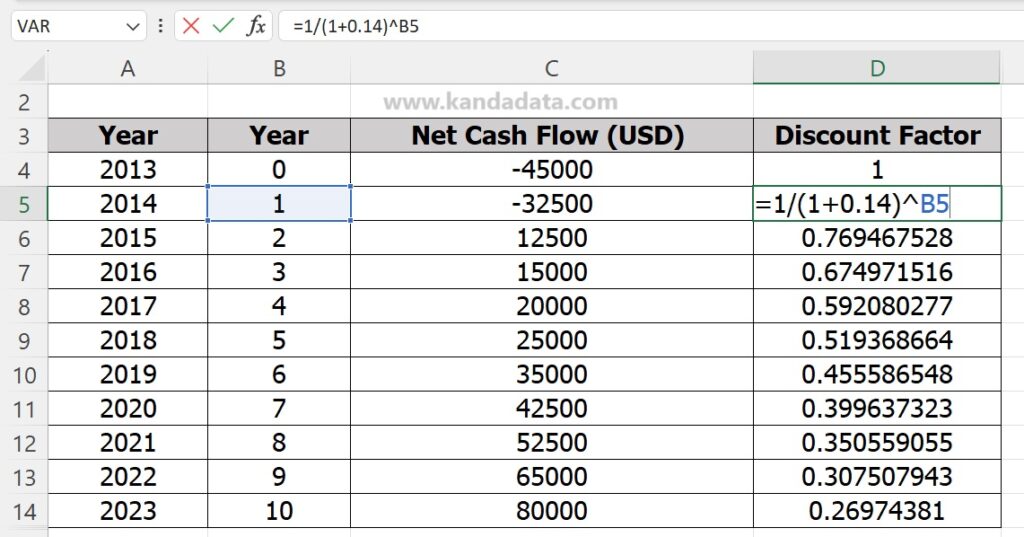
To manually calculate NPV in Excel, the first step is to create a sequence of years (Year 0, Year 1, and so on). Then, calculate the discount factor using the formula =1/(1+df)^t.
After calculating the discount factor, obtain values for each year (Year 0 to Year 10). Detailed calculations can be seen in the table below:
Next, calculate the present value for each observation by multiplying the net cash flow by its discount factor. Detailed results are shown in the table below:
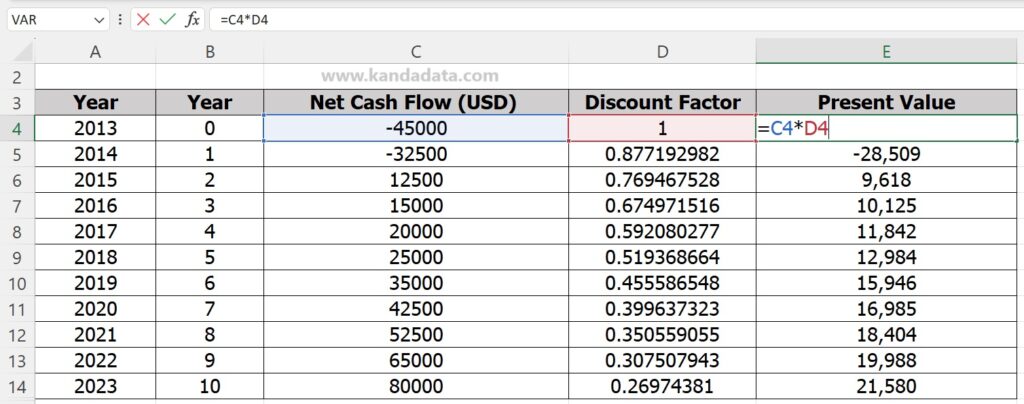
Finally, sum the present values. The sum represents the Net Present Value (NPV), which is $63,962 USD. Excel formula calculation would yield the same result. Detailed NPV values can be seen in the table below:

Interpreting NPV Values
Interpreting the Net Present Value (NPV) is crucial in investment decision-making. The NPV calculated in this case study is $63,962 USD, indicating a positive NPV.
A positive NPV suggests that the present value of expected future net cash flows is greater than the initial investment cost. Consequently, the project or investment is considered profitable, creating value for the company. Choosing to accept a project or investment with a positive NPV is deemed a sound decision.
Thank you for taking the time to read this article. I hope it proves valuable and insightful. Stay tuned for more updates from Kanda Data next week.