Blog
How to Calculate the Analysis of Variance (ANOVA) Table In Simple Linear Regression

Analysis of Variance (ANOVA) is often used in experimental research with different treatments. In simple linear regression, there is also ANOVA. Some often refer to ANOVA as the F test. In simple linear regression analysis, the statistical software output will display an ANOVA table. In addition to understanding how to interpret the ANOVA table, you also need to understand how to calculate it manually.
Based on this, I will take this opportunity to give a tutorial on “How to calculate the analysis of variance (ANOVA) table in simple linear regression”. In this tutorial, I will use Excel to make it easier to perform ANOVA table calculations.
The research cases that will be discussed still use the same data as I have conveyed in several previous articles. If you want to learn from scratch to calculate simple linear regression analysis manually, you can read the previous article entitled:
2. “How to calculate a coefficient of determination (R Square) in simple linear regression.”
3. “How to determine Y Predicted, Residual, and Sum of Squares in Simple Linear Regression.”
ANOVA Table
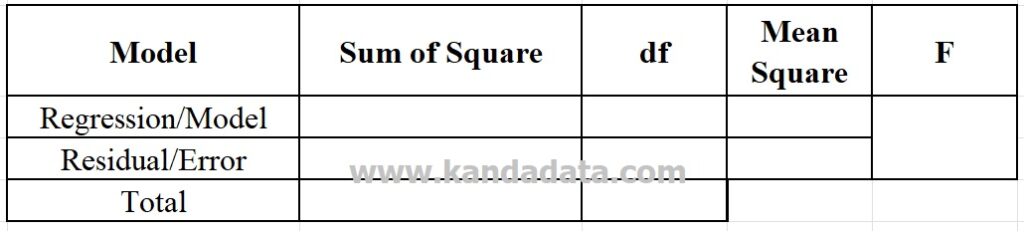
In the regression ANOVA table, you will find components consisting of the sum of squares, degree of freedom, mean squares, and F value. Each of these components needs to be calculated for regression/model and residual/error.
Calculating all components in the ANOVA table will be closely related to the article “How to determine Y Predicted, Residual, and Sum of Squares in Simple Linear Regression”. In this article, one of them is calculating the sum of squares.
The value of the sum of squares must be known before you can calculate the value of the mean square and the value of F. The sum of squares is divided into the regression sum of squares and the residual sum of squares.
In principle, the ANOVA table for simple linear regression is the same as the other ANOVA tables. For more details, you can see the ANOVA table form as follows:
Sum of Squares
In the regression ANOVA table, we need to calculate the regression sum of square and residual sum of square values. Then the total value of sum of squares is obtained from the sum of the regression and the residual sum of squares.
The formula for calculating the sum of squares refers to the book written by Koutsoyiannis (1977), namely:

Based on the above formula, to get the regression sum of squares and residual sum of squares, you need to find the predicted Y value and the actual average of Y. Next, you can perform mathematical operations following the formula above.
Degree of Freedom (df)
To find the mean square value in the ANOVA table, you need to calculate the sum of squares and the degree of freedom. Therefore, the calculation of the second stage is to calculate the value of the degree of freedom.
The value of the degree of freedom is divided into two, namely the degree of freedom regression and the degree of freedom residual. Total df is obtained by adding up df regression and df residual.
Df is also used to find table F values. Comparison of F value with F table is used for hypothesis testing. The formula for finding the df value can be seen in the formula below:

Based on the above formula, K is the sum of all the variables used in the model. This time we use simple linear regression analysis, then the K = 2, which includes one dependent variable and one independent variable.
Furthermore, n is the total number of observations used in the model. The example of the research we discussed consisted of 10 time-series data. Therefore, the value of n is 10.
Mean Squares
The mean squares value in the ANOVA table is also divided into regression mean squares and residual mean squares. The regression mean squares value is obtained by dividing the regression sum of squares by the regression degree of freedom.
The residual mean squares value is obtained by dividing the residual sum of squares by the residual degree of freedom. In more detail, the formula for calculating mean squares can be seen in the equation below:
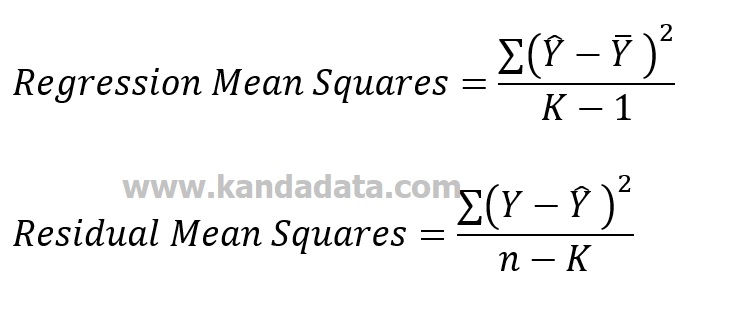
Furthermore, you can calculate using mathematical operations following the above formula.
F-Test
The value of F is very important in its function as a basis for hypothesis testing. The value of F is obtained by dividing the value of the regression mean squares by the residual value of the mean squares. The formula for calculating the value of F is:

To test the hypothesis, you need to find the F-table value first. According to your research hypothesis, the F-table value can use a p-value of 5% or 10%.
In finding your F-table value, you can use regression df and residual df. You can also lookup the F-table values directly in excel by typing the formula: =FINV(probability,deg_freedom1,deg_freedom2)
Calculation of ANOVA Tabel Table
In calculating the ANOVA table, in this article, I use the data on the research sample: “How to Calculate bo and b1 Coefficient in Simple Linear Regression Using Original Sample Observation.”
The results of the calculations following all the formulas that I have conveyed above, I get an F value of 43.6176. In detail, the results of the ANOVA table calculation using excel can be seen in the image below:

You can check the calculation results by comparing them with statistical software output. I have done data processing using SPSS, with the results of the ANOVA table as follows:
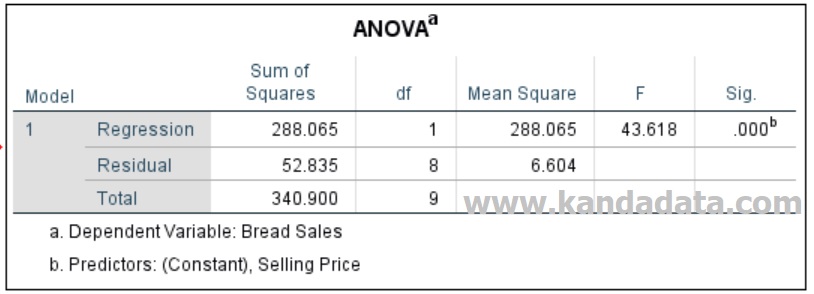
Now, you compare the calculation results with the SPSS output. If the results are the same as the two images above, it means that your calculation results are correct. For a detailed explanation of how to calculate and interpret ANOVA tables in simple linear regression, I highly recommend the book Regression Analysis: An Intuitive Guide for Using and Interpreting Linear Models.
Well, that’s the video tutorial on calculating an ANOVA table on simple linear regression. I hope it will be beneficial for all of us. See you in the next article!


Pingback: How to Find Variance, Standard Error, and T-Value in Simple Linear Regression - KANDA DATA
Pingback: How to Determine ANOVA Table in Multiple Linear Regression - KANDA DATA