Blog
How to Perform Multiple Linear Regression using Data Analysis in Excel

Researchers have widely used linear regression analysis to analyze a phenomenon. The regression analysis is intended to determine the effect of independent variables on the dependent variable. Researchers use linear regression analysis, and practitioners in the industry also often use linear regression analysis. The output of linear regression analysis can be used for consideration in making business decisions in a company.
Besides that, linear regression analysis can examine the factors that influence an observed variable. In various scientific fields, one of the scientific fields that use a lot of linear regression analysis is the field of economics and management.
In connection with the importance of linear regression analysis, researchers are expected to be able to carry out regression analysis independently. Researchers can perform regression analysis either by doing calculations manually or with the help of statistical software for data analysis.
As we all know, Excel is an office application that people use widely worldwide. Excel is widely used to assist in the simple and complex data processing.
Did you know that Excel can also help researchers to do linear regression analysis easily and quickly? On this occasion, Kanda Data will share tutorials on linear regression analysis using Excel.
In this article, Kanda Data presents a tutorial on how to do linear regression analysis using the data analysis toolpak in Excel. Researchers who want to practice doing analysis with manual calculations can read several previous articles, one of which is entitled: “Finding Coefficients bo, b1, b2, and R Squared Manually in Multiple Linear Regression“.
Example of a case study of linear regression analysis
The linear regression analysis intends to determine how the independent variables influence the dependent variable. Therefore, to construct an equation in linear regression, the researcher needs to determine the dependent and independent variables.
To distinguish these variables, the dependent variable is the variable that is influenced, while the independent variable is the variable that influences. To make it easier for researchers to understand how to do linear regression analysis using the data analysis toolpak in Excel, Kanda Data has prepared a case study example of research using weekly time series data from the first week to the 15th week.
The purpose of the case study is to determine the effect of operational costs, input prices, and marketing staff on product sales. Based on these objectives, researchers can determine that the dependent variable is the sales product while the independent variables are operational costs, input prices, and marketing staff.
Thus, based on the case example, it can be seen that the researcher uses multiple linear regression. Multiple linear regression is a regression with independent variables equal to or more than two variables. The data that researchers in detail have collected can be seen in the image below:
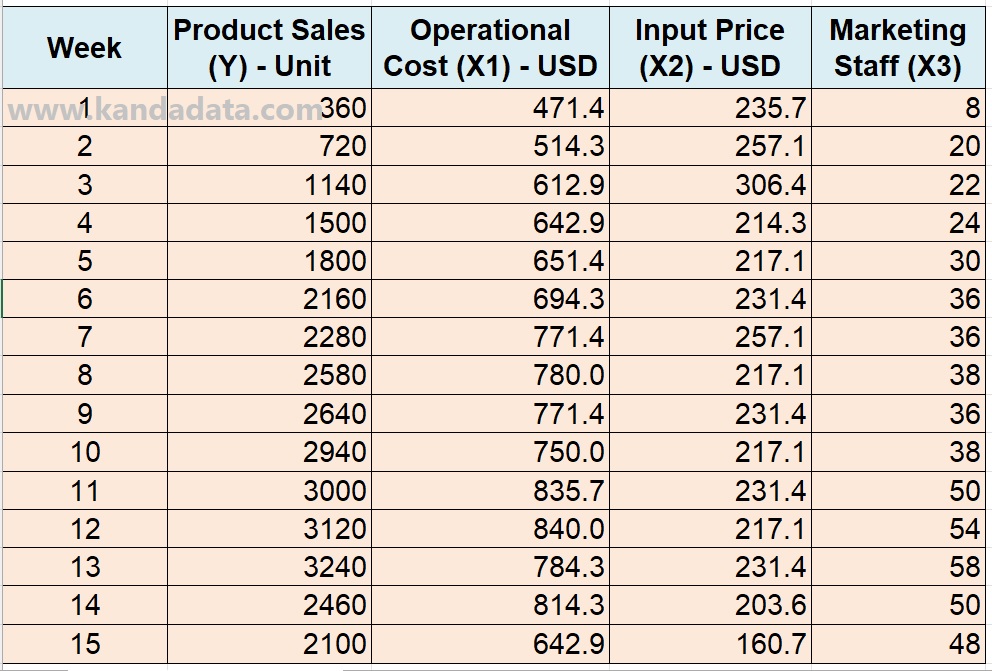
Based on the picture above, before Kanda data continues the tutorial on how to analyze multiple linear regression using data analysis in Excel, researchers need to understand that based on the variables used, it is measured on a ratio scale.
On this occasion, Kanda Data used multiple linear regression with the Ordinary Least Square method. To produce the best linear unbiased estimator, the researcher must ensure that all the assumptions required in the OLS method’s multiple linear regression have been tested and meet the requirements. The tutorial on how to test the linear regression assumptions of the OLS method has been written by Kanda Data in a separate article.
Prepare Data Analysis Menu in Excel
In Excel, researchers can analyze multiple linear regression similar to other statistical software. Researchers can use the data analysis menu in Excel.
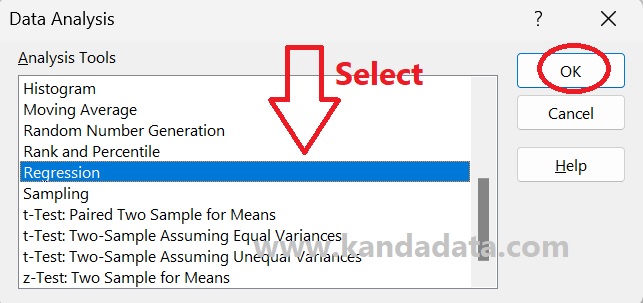
To find the data analysis menu, after you open the Excel file, click the menu, and there will be a data analysis menu in the upper right corner. If the data analysis menu is clicked, a selection of analysis tools provided by Excel will appear as shown below:
If the researcher does not find this menu, it means that the researcher has not activated the data analysis tool in Excel. Researchers only need to perform a few additional steps to enable data analysis in Excel. For a tutorial on activating data analysis in Excel, you can read the previous article entitled: “How to Activate and Load the Data Analysis Toolpak in Excel“.
Linear Regression Analysis Steps in Excel
After researchers have succeeded in activating the data analysis toolpak menu in Excel, the next step is that researchers need to choose regression from several tools provided by Excel.
After clicking ok, then the regression window will appear. In this window, the researcher will be asked to input data from all the variables used. The first step the researcher needs to input is variable Y data or dependent variable into point 1, which in detail can be seen in the image below:
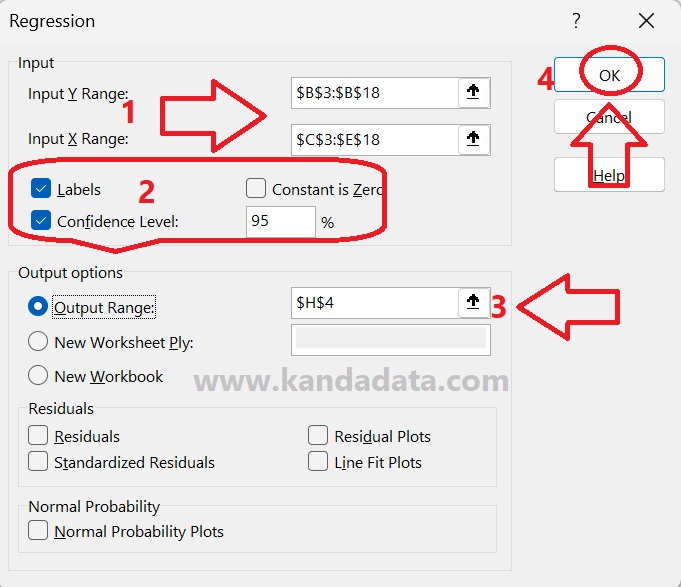
Based on the picture above, the researcher needs to input all independent variable data (variable X), from the variable advertising costs, input prices, and marketing staff, into point 1.
To make it easier to identify and interpret, researchers need to input variable Y and variable X, including the variable name labels. Furthermore, on the second point, enable labels and confidence level at 95%.
In the third step, the researcher will be asked to save the multiple linear regression analysis results in Excel. Researchers can choose 1 of the 3 options available. In the example above, Kanda Data will save the analysis output on the same Excel sheet. After clicking OK, then on the choice set, the output of multiple linear regression analysis will appear.
The output of multiple linear regression analysis
In the last step in the sub-chapter above, after the researcher clicks Ok, the output of multiple linear regression analysis will appear, which can be seen in the image below:
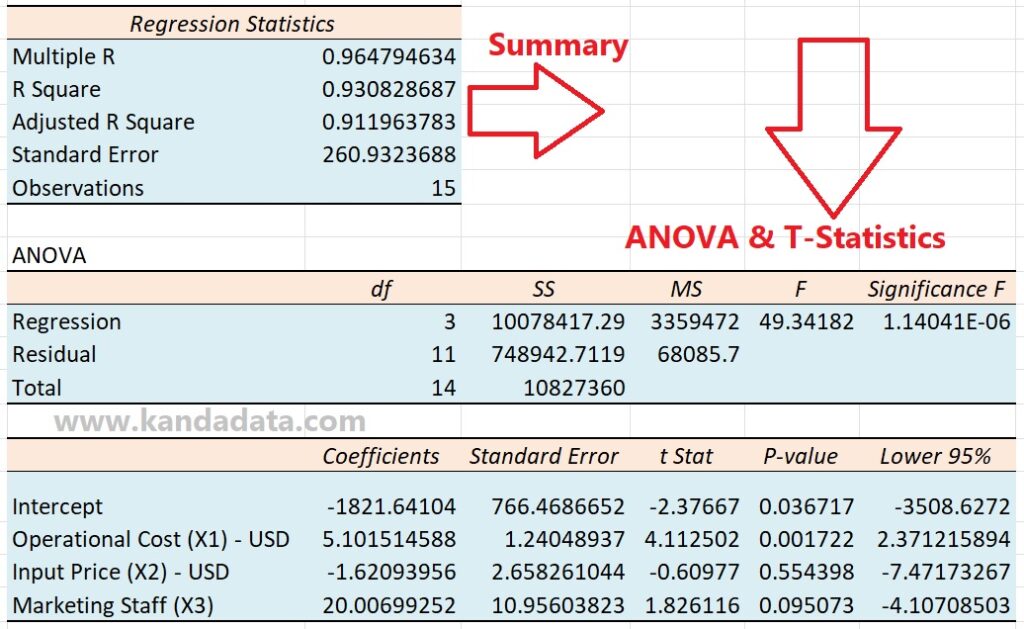
Based on the picture above, the output of multiple linear regression analysis with the default method includes a summary, ANOVA tables and tables containing the estimated coefficients of the independent and intercept variables.
The summary table shows the information on multiple R, R Square, adjusted R Square, and standard error. Furthermore, in the ANOVA table, the statistical F value and P value will be obtained. As for the table below, we will obtain the intercept values and estimated coefficients from the variables of operational costs, input prices, and marketing staff.
Based on this table, researchers can perform statistical hypothesis testing by looking at the P value of each independent variable. Based on the results of the analysis above, it can be seen that at alpha 5%, only the operational cost variable significantly affects product sales.
The p-value of input price and marketing staff variables is greater than 0.05, so these two variables have no significant effect on product sales. It is a tutorial article that Kanda Data can write on this occasion. Hopefully useful for all of you. Wait for the Kanda data article update the following week!
2 comments
Leave a Reply
You must be logged in to post a comment.
Pingback: How to Enable Data Analysis Button for t-test in Excel - KANDA DATA
Pingback: How to Determine T-table and F-table in the linear regression analysis using Excel - KANDA DATA