Residuals are the differences between the observed values of the dependent variable and the predicted values from the dependent variable. Residuals are an important measure in inferential analysis, particularly in regression analysis. Given the importance of residuals, we will discuss how to find residual values using Excel.
Analyzing Rice Production Changes with a Paired t-Test Before and After Training Using Excel
Evaluating the effectiveness of extension programs is crucial to ensure that the interventions implemented provide positive impacts for farmers. One way to measure this effectiveness is by comparing production before and after the program using a paired t-test.
How to Perform Multiple Linear Regression in Excel | Data Analysis Toolpak Tutorial
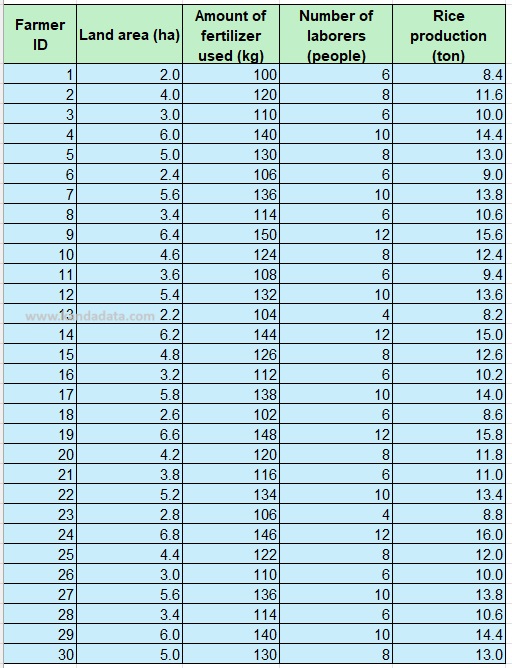
Multiple linear regression is a statistical method used to analyze two or more independent variables in relation to a dependent variable. In this article, Kanda Data will discuss how to perform multiple linear regression analysis using Excel through the Analysis Toolpak menu.
Data Transformation to Address Non-Normally Distributed Data
The assumption that data must be normally distributed is often a prerequisite for using certain inferential statistical tests. However, sometimes the test results do not meet expectations, indicating that the data is not normally distributed.
Handling Non-Normally Distributed Data by Removing Outliers
The topic I’m writing about today is prompted by questions on how to handle data that is not normally distributed. We know that in quantitative analysis, several statistical tests require that the data be normally distributed. This is an interesting topic that we will delve deeper into in this article.


