Blog
How to use data analysis for sampling in Excel

In research activities, researchers can take samples from the observed population. The purpose of sampling is motivated by time and cost limitations if observations are made on the entire population.
Even though the observations only take samples from the population, the conclusions can still represent the population. Therefore, researchers need to have good knowledge of sampling techniques.
Sampling techniques can be divided into probability sampling and nonprobability sampling. In the probability sampling technique, each member of the population has the same opportunity to be selected as the sample. Meanwhile, in non-probability sampling, not all population members have the same opportunity to be selected as the sample.
Probability sampling is the technique most often used by researchers in observing a population behavior whose sample frame is known. One of the sampling techniques most often used by researchers is simple random sampling.
Simple random sampling
Researchers can use simple random sampling if they have met at least two of the required assumptions. The first assumption is that a sample frame is available, and the second assumption is that members of the population are homogeneous.
On the first assumption, the researcher must already have data on the population that will be observed in the study. Furthermore, all members of the population have the same or homogeneous characteristics.
The researcher can use a simple random sampling technique if these two assumptions are met. As stated in the previous paragraph, simple random sampling provides equal opportunities for each member of the population to be selected as a sample.
What is the minimum number of samples to be representative?
If the researcher uses simple random sampling, the researcher can determine the minimum number of samples representing the population being observed. In the simple random sampling technique, researchers can use the Slovin formula to set a standard for a minimum number of samples to be representative.
Researchers can use a margin of error of 5% or 10% according to the conditions of the population to be observed. Researchers can use a larger margin of error in populations that are relatively difficult to control, which is 10%.
After obtaining a minimum number of representative samples, the next step is that the researcher can randomly select the number of samples from the population being observed.
How to choose a random sample on the simple random sampling technique
Researchers can select a random sample from the population in several ways. In principle, random selection is carried out by giving each member of the population the same opportunity to be selected as the sample.
Researchers can use random tables or data analysis for sampling in Excel. To make it easier to understand random sampling techniques, Kanda Data will provide tutorials on sampling techniques in Excel.
For example, there is a researcher who will take a random sample of the population of rice farmers in an area. For example, suppose there are 20 observed populations of farmers, as can be seen in the table below:
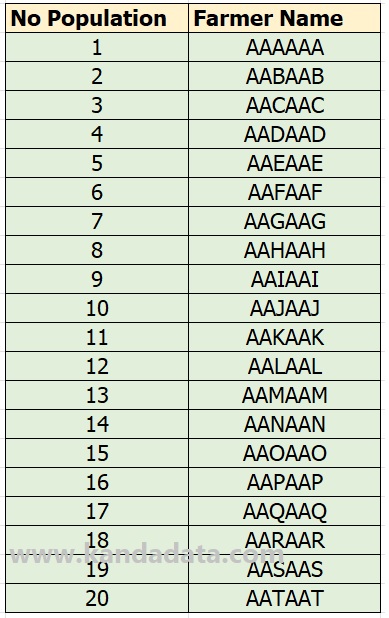
Based on the calculation of the Slovin formula along with the researcher’s justification, the number of samples to be observed is 40% of the population. Thus, the number of samples to be selected is 8 farmers.
Researchers must take a random sample of 8 people from a total farmer population of 20 people. On this occasion, Kanda Data gave a sampling technique tutorial using data analysis in Excel.
How to use data analysis for sampling in Excel
Researchers can use Excel to select a random sample from the population under study. The tutorial will be presented on selecting a random sample using the data analysis toolpak in Excel.
The data analysis toolpak in Excel can be accessed by clicking the Data menu. In the upper right corner, the Data Analysis menu will be available, as can be seen in the table below:
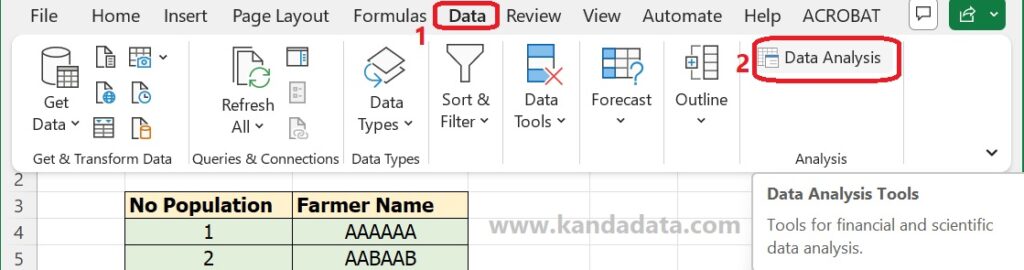
If it turns out that the Data Analysis menu is not available in the upper right corner, it means that the Excel data analysis toolpak needs to be activated first. How to activate the Data Analysis menu in Excel can read the previous tutorial article entitled: “How to Enable Data Analysis Button for t-test in Excel“
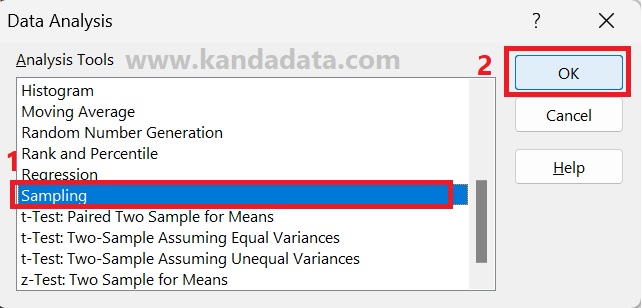
If the Data Analysis menu is available in Excel after clicking it, several analysis tools provided by Excel will appear. The next step that needs to be done by researchers is to choose sampling as in the image below:
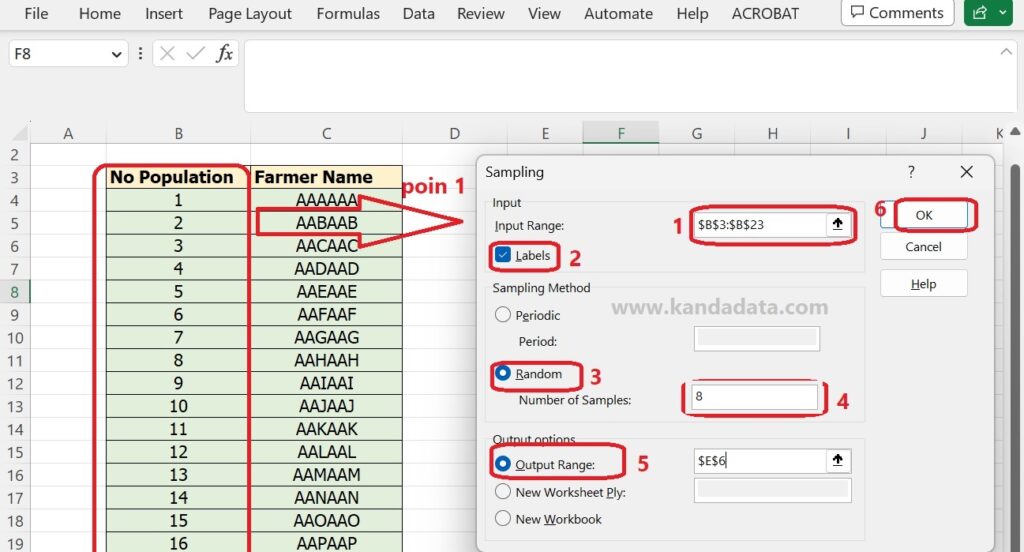
After clicking, the Sampling window will appear. The next step that needs to be done by the researcher is to input the data to be sampled.
The trick is that the researcher clicks on the input range, then selects the population serial number and its label. Next, on the second point, do not forget to enable labels.
Following the paragraph earlier, the number of samples to be taken is as much as 40% of the total population. Therefore, the total sample will be taken from 8 farmers from the population.
Thus, the sampling method is chosen randomly. Next, fill in the number of samples with 8. The final step is for the output options to be saved on the same Excel sheet, which in detail can be seen in the image below:
After clicking ok, 8 farmer samples will be selected randomly from the 20 farmers population. In detail, the results of random sample selection using the data analysis toolpak in Excel can be seen in the image below:
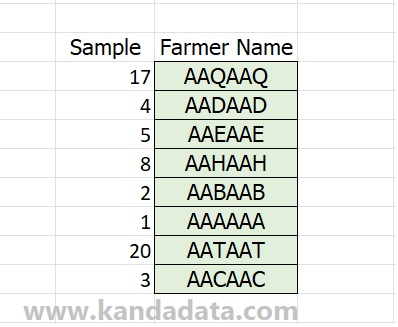
Based on the picture above, after obtaining the number of samples selected, the next step for researchers is to adjust the names of the samples’ names according to the selected sample’s serial number. It is a sampling technique tutorial using data analysis in Excel. Hopefully, this is useful and provides new insights for everyone. Thank you.