Tag: multiple linear regression
How to Perform Multiple Linear Regression in Excel | Data Analysis Toolpak Tutorial
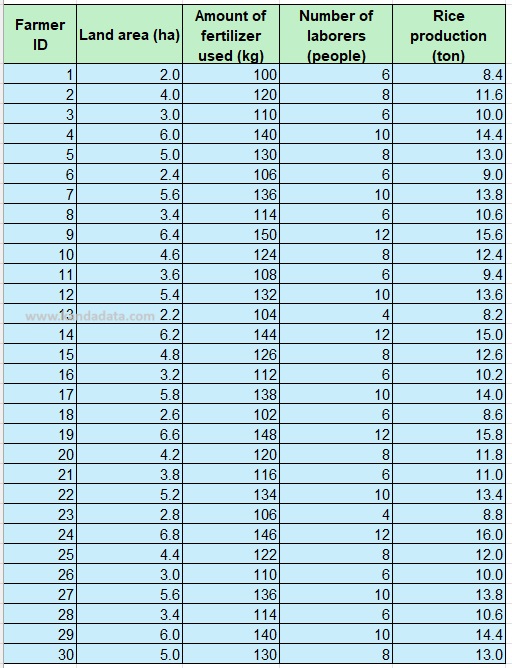
Multiple linear regression is a statistical method used to analyze two or more independent variables in relation to a dependent variable. In this article, Kanda Data will discuss how to perform multiple linear regression analysis using Excel through the Analysis Toolpak menu.

Dummy Variables in Multiple Linear Regression Analysis with the OLS Method
Multiple linear regression analysis is a well-known technique frequently used by researchers to analyze the influence of independent variables on dependent variables. The ordinary least squares (OLS) method is one of the most commonly used methods in this analysis.

Multicollinearity Test in Multiple Linear Regression Analysis
In multiple linear regression analysis, there is an assumption that the model constructed is not affected by multicollinearity issues, where two or more independent variables are strongly correlated. Multicollinearity can lead to errors in parameter estimation and reduce the reliability of the model.

How to Determine the F-Table Value (F Critical Value) in Excel
In assessing the fit of a linear regression model, researchers need to find the critical values from the F-distribution (F-table). Typically, researchers often use these tables to evaluate the results of regression analysis. However, with technological advancements, determining the F-table value can easily be obtained using Excel.

How to Determine the T-table (T critical value) in Excel for Linear Regression Analysis
In linear regression analysis, to determine the significance of the regression coefficients, researchers need to find the critical values from the t-student distribution (T-table). Typically, researchers often use these tables to evaluate the results of regression analysis. However, with technological advancements, determining the T-table value can easily be obtained using a spreadsheet, such as Excel.

Assumptions Required in Multiple Linear Regression Analysis Using Ordinary Least Squares (OLS) Method
Multiple linear regression with the Ordinary Least Squares (OLS) method is one of the statistical techniques used to assess the influence of two or more independent variables on a dependent variable. The OLS method is carried out by minimizing the sum of squared errors between the model’s predictions and the actual values of the dependent variable.

Understanding Normality Test in Ordinary Least Squares Linear Regression
Linear regression analysis examines the influence of independent variables on dependent variables. This analysis can take the form of simple linear regression or multiple linear regression. Most linear regression analyses utilize the Ordinary Least Squares (OLS) method.

How to Detect Multicollinearity in Multiple Linear Regression Equations Using the OLS Method
Multicollinearity testing is one of the assumptions in the least squares method of multiple linear regression. This test is conducted to determine whether there is a strong correlation between independent variables.