Blog
Testing and Interpreting Homoscedasticity in Simple Linear Regression with R Studio

Homoscedasticity is a crucial assumption in ordinary least square (OLS) linear regression analysis. This assumption refers to the consistent variability of regression residuals across all predictor values. Homoscedasticity assumes that the spread of residual regression errors remains relatively constant along the regression line.
When homoscedasticity is violated, the results of hypothesis testing and confidence intervals in regression analysis may become invalid. Therefore, researchers need to conduct this assumption test to confirm the homoscedasticity assumption or identify potential heteroscedasticity issues.
Several methods are commonly used to test homoscedasticity in regression, including the Glejser Test, Park Test, and Breusch-Pagan Test. This tutorial focuses on conducting the Breusch-Pagan Test for homoscedasticity using R Studio.
Steps for Testing Homoscedasticity in R Studio
Begin by creating a simple linear regression model. In this example, we’ll use “Y” as the dependent variable and “X” as the independent variable. For illustration, let’s consider a case where “Y” represents product sales measured in units, and “X” is the product price measured in USD per unit. In detail, the data used for the analysis exercise can be seen in the table below:
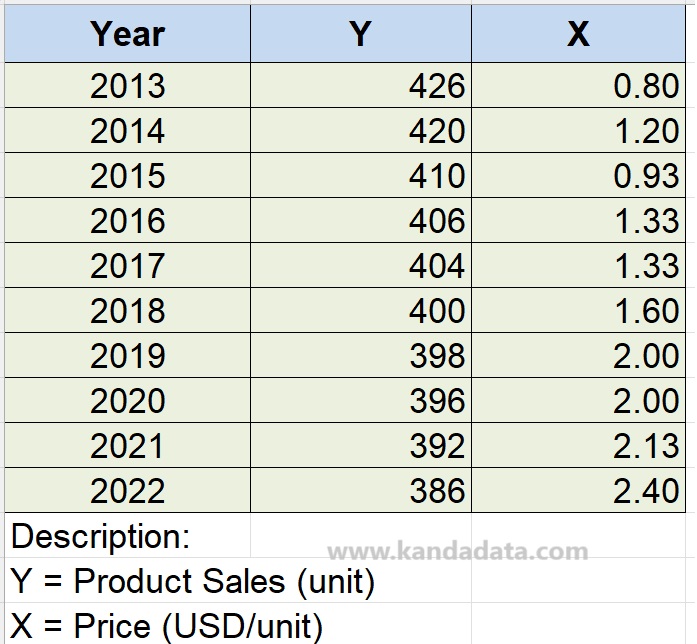
Please open R Studio and import data from the Excel file according to the table above. In the mentioned table, I named the Excel file “Regression,” which I will use later to create commands in R Studio.
Begin by conducting a simple linear regression analysis by executing the following command in R Studio:
model <- lm(Y ~ X, data = Regression)
To test homoscedasticity using R Studio, execute the following command:
library(lmtest)
bptest(model)
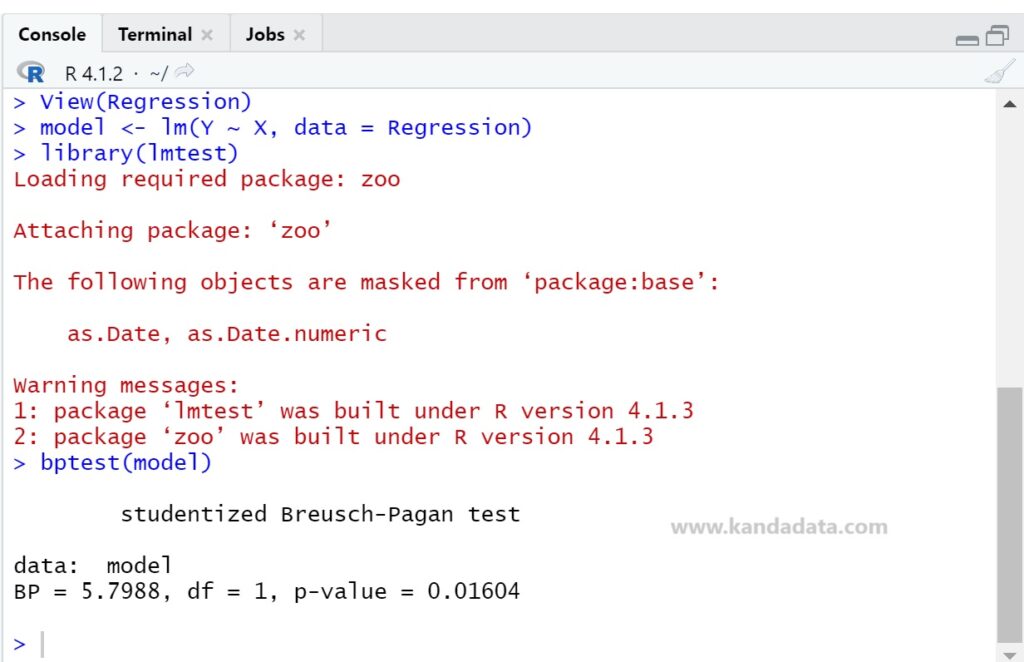
Next, after pressing enter, the analysis output will appear in detail, as shown in the image below:
Interpreting Homoscedasticity Test Results
The Breusch-Pagan Test assesses homoscedasticity in linear regression, and its interpretation involves examining the generated p-values. This test measures how much the residual variance in regression can be explained by independent variables.
From the analysis, the Breusch-Pagan Test yields a BP value of 5.7988 with a p-value of 0.01604. At a significance level of 0.05, the p-value (0.01604) is smaller than the set significance level. Therefore, there is sufficient evidence to reject the null hypothesis.
Interpretation Criteria:
Ho = p-value > 0.05 = Homoscedasticity (constant residual variance)
H1 = p-value < 0.05 = Heteroscedasticity (non-constant residual variance)
Consequently, rejecting the null hypothesis implies significant evidence of heteroscedasticity in the linear regression model. This concludes the tutorial article. I hope it proves helpful and adds value to our knowledge. Stay tuned for more articles from Kanda Data next week.